Chapter Nine: Support Vector Machines
Conceptual Problems
Problem One
Part a)
The Hyperplane $H_1 = 1 + 3X_1 - X_2 = 0$ is plotted below.
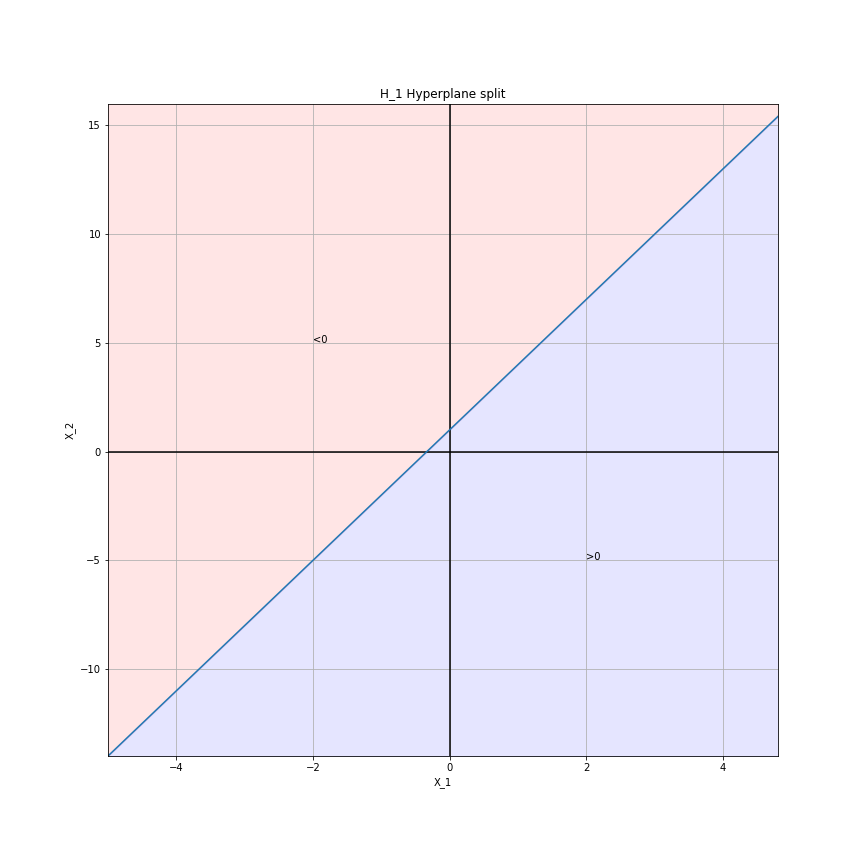
The red region corresponds to solutions $H_1 < 0$ and the blue region $H_1 > 0$.
Part b)
The Hyperplane $H_1 = -2 + X_1 - 2X_2 = 0$ is plotted below.
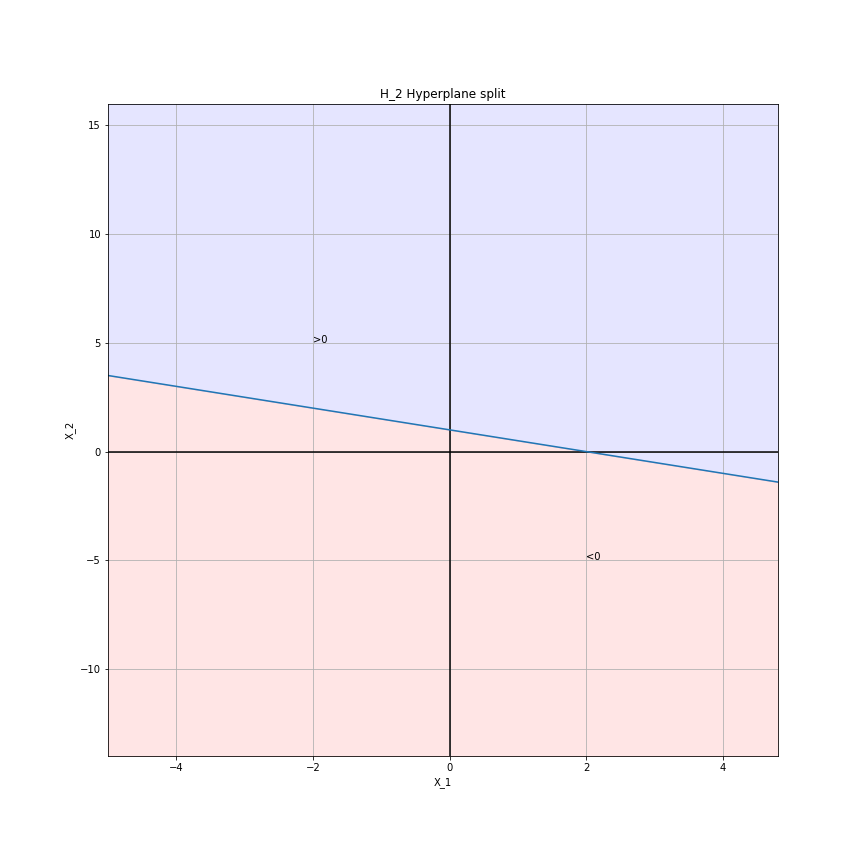
The red region corresponds to solutions $H_2 < 0$ and the blue region $H_2 > 0$.
Problem Two
Part a)
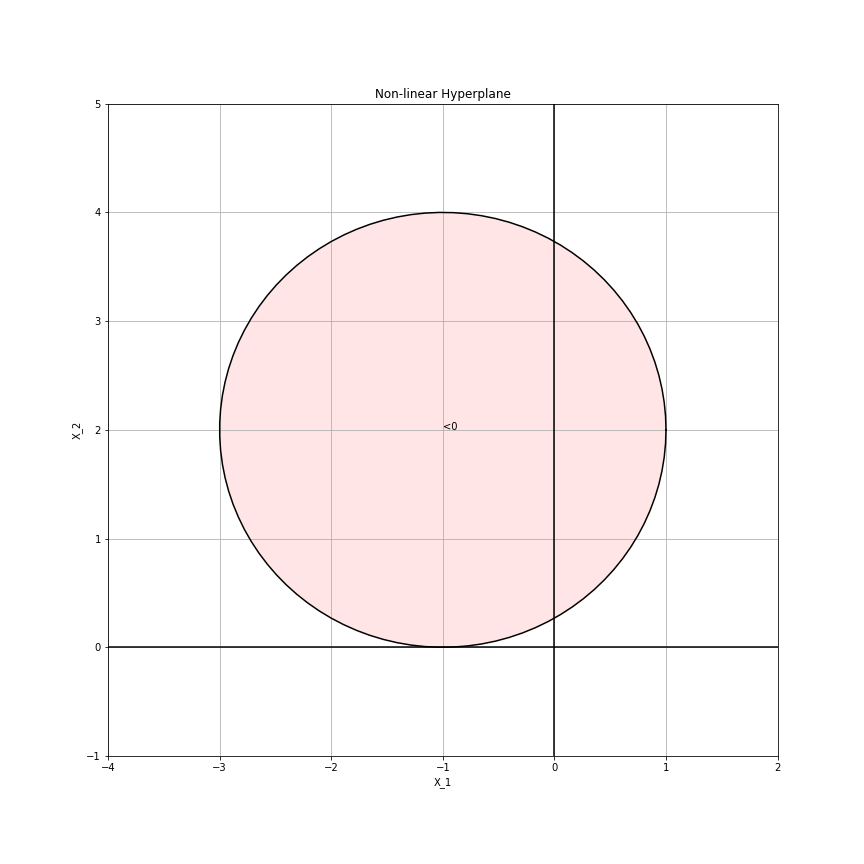
The non-linear hyperplane $H = (X_1 + 1)^2 + (X_2 - 2)^2 - 4 = 0$ which is a simple circle.
Part b)
The region $H<0$ is shaded red. Other wise, the solution is $H \geq 0$.
Part c)
$$ \begin{aligned} (0,0) &\rightarrow \text{Red} \\(-1,1) &\rightarrow \text{Red} \\(2,2) &\rightarrow \text{Not Red} \\(3,8) &\rightarrow \text{Not Red} \end{aligned} $$
Part d)
This is similar to the case of linear regression being used to model non linear model by expanding the feature space with not linear functions of the original predictors.
Problem Three
Part a)
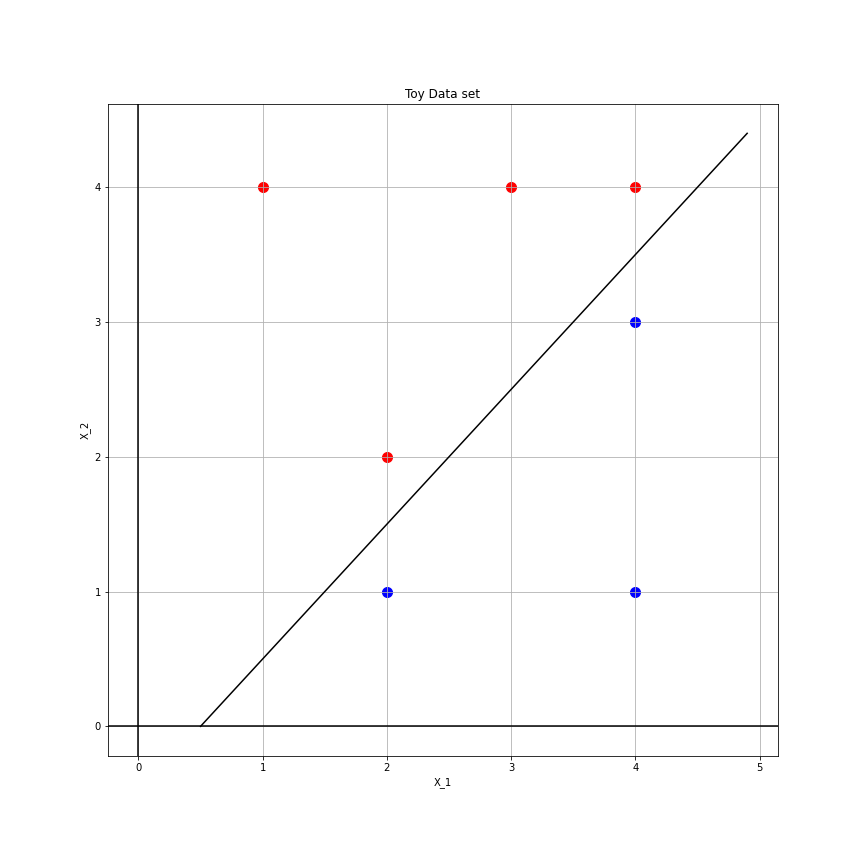
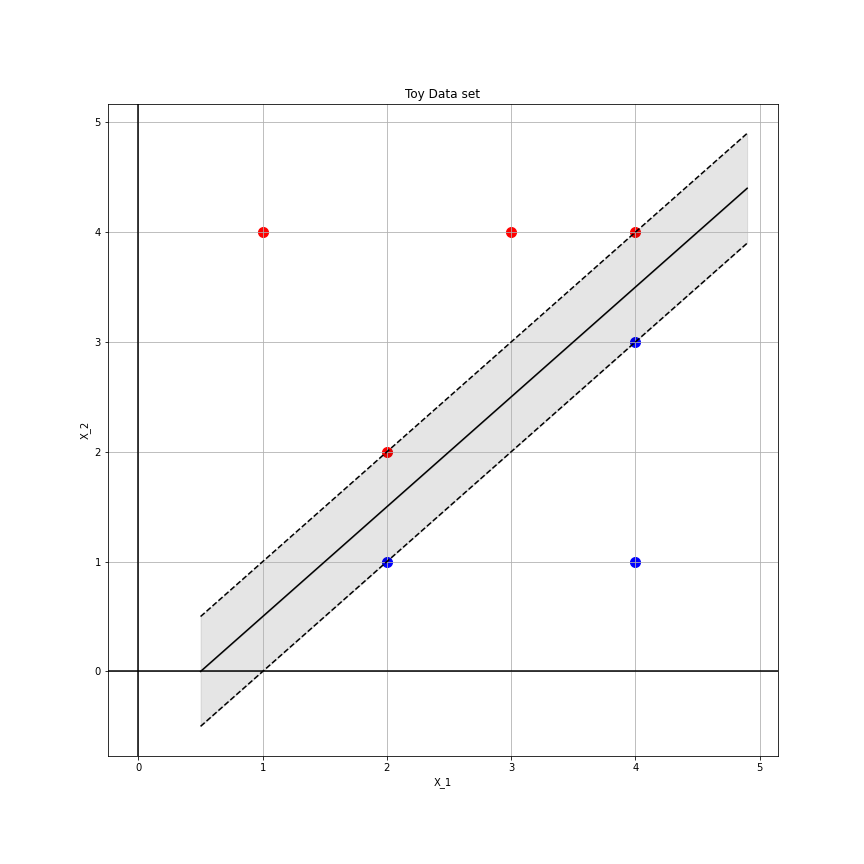
A plot of the classified observations is below.
Part b)
From observation the maximal margin hyperplane is, $$ X_1 - X_2 -0.5 = 0. $$ The separating hyperplane has been plotted in the figure above.
Part c)
Blue if $X_1 - X_2 -0.5 > 0$ and red if $X_1 - X_2 -0.5 < 0$.
Part d)
The margin for the maximal margin hyperplane is showing in grey below,
Part e)
The support vectors are those which the dotted lines go through in the above figure.
Part f)
A slight movement of the 7th point will have no effect as it is not a support vector. It will only have an affect if it were moved within the margin indicted in the figure.
Part g)
Any other line will not be an optimal separating hyerplane.
Part h)
An eighth point at (2,3) (for example) will mean there is not optimally separating hyperplane.